Project title : ALD’s fuel level App
Elevator Pitch.
Description.
Download and Test.

scan with your android device to get the app
This App may be tested using either the emulator (I did not test it) or using a phone or tablet. The data used to display either a table or a chart comes from a google spreadsheet. So the device must be able to download data on the internet.To download the app, scan the QR code to the left with the MIT AI2 Companion app or some other Scanner or click on this download link (Fioul_project_AL.apk).
You may also download the .aia file : Fioul_project_AL (.zip). The .zip should be renamed to .aia if you want to see the whole project on App Inventor 2, and look at the design view and the blocks used.
Technical Description.
The app goes beyond the minimum technical requirements. and it uses a component which we did not use during the course : the web viewer. The web viewer makes use of an html file, in which a script in Javascript produces the line chart or table display.
App screenshot
A screenshot of the app when displaying line chart of the data. The user just touched the screen so that more information is displayed on the chart where it was touched.
Data Abstraction.
The app must include at least two variables and must make use of either a list or a database.
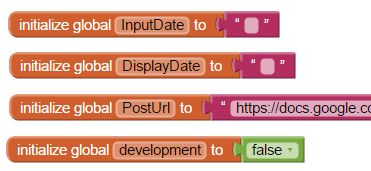
4 global variables (no local ones) are used :
Lists are used :
The database is a google spreadsheet, called through the app inventor code. Displaying the data inside the app is done using the Google Chart API.
Procedural Abstraction.
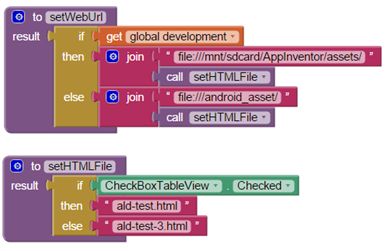
The app must include at least two programmer-defined procedures or functions.
6 programmer-defined procedures are included. Here are two.
Algorithms and Control.
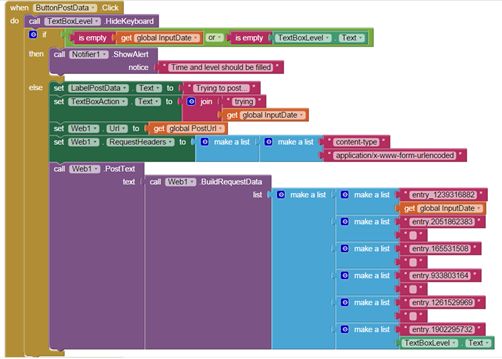
The must include at least one if/else structure or one loop.
5 if/then or if/then/else structures are used. Here is one.
What I know should be improved
- The user interface is not very nicely set.
- It is not very easy to know what to do with the app. I’m not sure I would have done better had the app been done for anyone and not just myself.
- If there were a lot of rows in the database (the google spreadsheet), it would be necessary to add user controls, in order to display only specific data, as selected by the user.


Commentaires récents